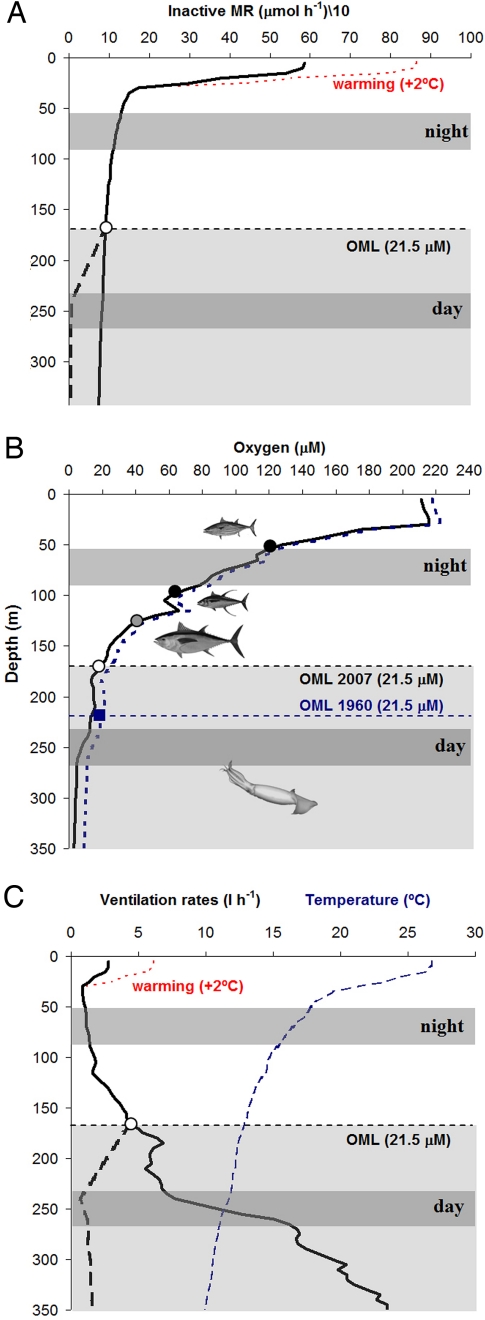
Fig. 3.
Metabolic physiology and vertical ecology of Dosidicus gigas. (A) Projected inactive metabolic rates (10-g animal, μmol O2 h−1, black solid line) as a function of depth in the Gulf of California. The thick black dashed line reflects the expected metabolic depression after reaching the squid's critical oxygen partial pressure, Pc (21.5 μM, open circle) (21). The thin red dashed line shows the increase in metabolic rate because of expected ocean surface warming (2°C) in the Eastern Tropical Pacific (ETP) (2). Gray bars represent the main depth range occupied by D. gigas during daytime (≈250 m) and nighttime (≈70 m) periods (21). (B) Depth-related changes in oxygen levels (ml liter−1, black solid line) and hypoxic thresholds (critical PO2, Pc, symbols) of several ETP top predators. Note that the partial pressure of oxygen (i.e., the actual driver of oxygen flux into the organism) at a given concentration will vary with temperature. Open circle, jumbo squid's Pc; light gray circle, bigeye tuna (Thunnus obesus); deeper black circle, yellowfin tuna (Thunnus albacares); and shallower black circle, skipjack tuna (Katsuwonus pelamis). Sources for tuna data are available in Table S4. The thick blue dashed line represents the predicted oxygen levels in 1960. These estimates were based on a decrease in oxygen of 0.13 μmol kg−1 year−1 from 1960 to 2008 in the ETP pelagic ecosystem (12). The expansion of the oxygen-minimum layer (OML) drives the hypoxic threshold to shallower depths (illustrated by the change in the squid's Pc, blue square and open circle), causing a more compressed epipelagic habitat. The bathymetric difference between the past and the present 21.5-μM (≈0.5 ml liter−1) oxyline is 65 m. (C) Temperature (°C, thin blue dashed line) and projected ventilation rates in D. gigas (10-g animal) as a function of depth. Ventilation rate (l h−1, black solid line) equals the water volume from which all O2 must be extracted per hour to support standard metabolism. The thick black dashed line reflects the expected ventilation rate reduction after reaching the squid's Pc. The thin red dashed line shows the increase in ventilation rate because of the ocean surface warming.

