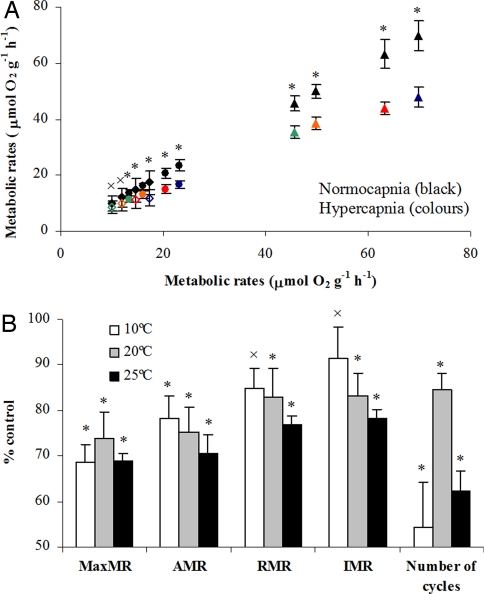
Fig. 4.
Effect of hypercapnia in the metabolic physiology of jumbo squid, Dosidicus gigas. (A) Mean oxygen consumption rates (± SE; μmol O2 g−1 h−1) under control (black symbols) and hypercapnic treatments at inactive (IMR), routine (RMR), active (AMR), and maximum (MRM) levels (green, orange, red, and blue symbols, respectively). Oxygen consumption rates under control conditions are plotted against themselves and against rates of those same individuals under elevated (0.1%) CO2. Open diamonds, 10°C; solid circles, 20°C; solid triangles, 25°C (plots with individual runs are available in supporting online material). (B) Oxygen consumption rates and activity levels (number of active cycles per hour) under high CO2 expressed as a percentage of the control values at the three different temperatures. *, significant differences (paired t test, P < 0.05); ×, nonsignificant differences (paired t test, P > 0.05)

