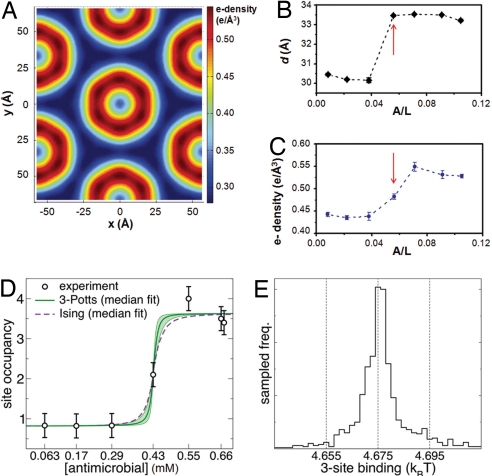
Fig. 4.
Cooperativity of antimicrobial occupation is described by a Potts model. (A) A typical electron density profile of the 2D hexagonal unit cell confirms the formation of an inverted hexagonal structure. Here, we show the 2D plot of the reconstructed electron density profile at A/L = 1/14. The light blue regions have low electron density (≈0.29 e/Å3) and correspond to hydrocarbon chains of the lipids, whereas the “rims” in dark red have the highest electron density (≈0.55 e/Å3) and correspond to the regions near phospholipid head groups. The rim centers in lighter blue have intermediate electron density (≈0.33 e/Å3) and correspond to water within hydrophilic channels. (B and C) The diameter of water channels (B) and the electron density at the hydrophilic surface of lipid membranes (C) change abruptly as A/L increases (red arrows). (D and E) By analogy with exactly solvable 1D magnetic systems, we deduce thermodynamic parameters governing antimicrobial cooperativity in generating the necessary negative membrane curvature, using the antimicrobial occupancy data in the induced HII phase. We estimated the antimicrobial occupancy based on the relative enhancement in electron density around the hydrophilic membrane surface. Using Bayesian sampling of model fits, we show the range of predictions obtained from 1D 3-Potts and the simpler Ising model fits (D). Both 3-Potts model and Ising model give excellent fits with identical values for E1–3. We find that the antimicrobial occupation as a function of system-wide antimicrobial concentration is highly nonlinear, but is well described by a simple two-level system of singly and triply occupied states separated by a well defined free energy difference E1–3 of ≈ 4.68 kT, which quantifies the cooperativity in these antimicrobials. (E) The posterior distribution with normal likelihood from the experimental data are sampled by using Monte Carlo for 105 steps, and an ensemble of 103 3-Potts model parameter choices are taken. The median predicted site occupancy with upper and lower quartiles show the range of model predictions. The E1–3 binding free energy has the narrowest distribution with a full width of 0.04 kT (a measure of the statistical uncertainty of the fit, independent of the experimental error), whereas the other model parameters have variability of at least 1 kT. The histogram of E1–3 binding parameters from the Bayesian sampling shows this narrow distribution.

