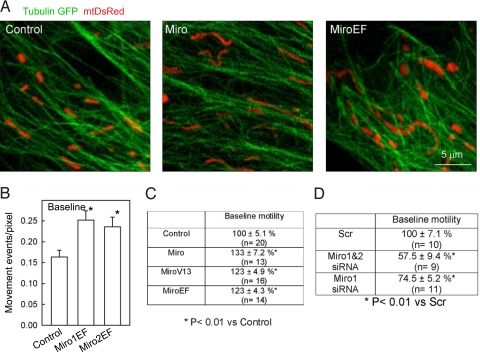
Fig. 1.
Miro promotes mitochondrial movements along microtubules at basal [Ca2+]c in H9c2 cells. (A) Confocal images of TubulinGFP and mtDsRed taken in control (Left), Miro1&2 (Middle), and Miro1&2EF-expressing cells (Right). (B) Actual basal mitochondrial motility values (Left) in cells transfected with mitoYFP alone or mitoYFP+Miro1EF or mitoYFP+Miro2EF. *, P < 0.01. (C) Summarized data of baseline mitochondrial motility (Mito-motility) in cells transfected with mitoYFP (Control; n = 20 cells), mitoYFP+Miro (n = 13), mitoYFP+MiroV13 (n = 16), and mitoYFP+MiroEF (n = 14). Before imaging, cells were pretreated with thapsigargin (2 μM) in a Ca2+-free ECM for 7 min to eliminate both intracellular Ca2+ mobilization and Ca2+ entry and in turn to stabilize [Ca2+]c under the basal level (≈40 nM). Data are shown as % of control. (D) Summarized data of baseline Mito-motilities in MitoYFP expressing cells transfected with either scrambled control (Scr; n = 10), Miro1-siRNA (Miro1; n = 11), or Miro1&2-siRNA (Miro1&2; n = 9). The mitochondrial movements were quantitated in a CCD time-series recorded at the resting [Ca2+]c (≈40 nM). Data present % of Scr.

