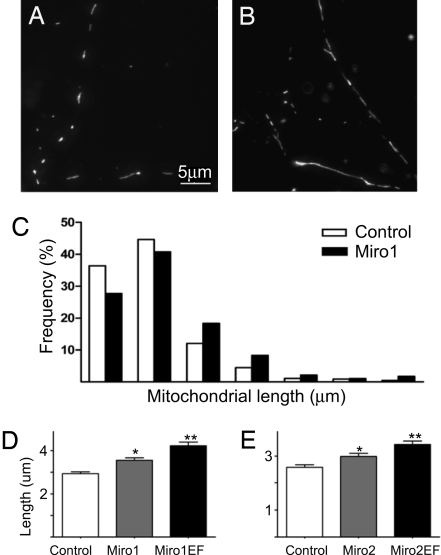
Fig. 5.
Mitochondrial distribution and length in Miro overexpressing neurons. (A–E) mtDsRed-labeled mitochondria (grayscale) in neuronal processes of control (A) and Miro1-over-expressing (B) neurons. Wide-field fluorescence micrograph shows the best focus slice of z-stack. Panel C shows the different frequency distribution of mitochondrial lengths in the Miro1 group, compared with the control. *, P < 0.001 vs. control, **, P < 0.001 vs. control and P < 0.05 vs. Miro1 (2) wild-type group (Dunn's multiple comparison test).

