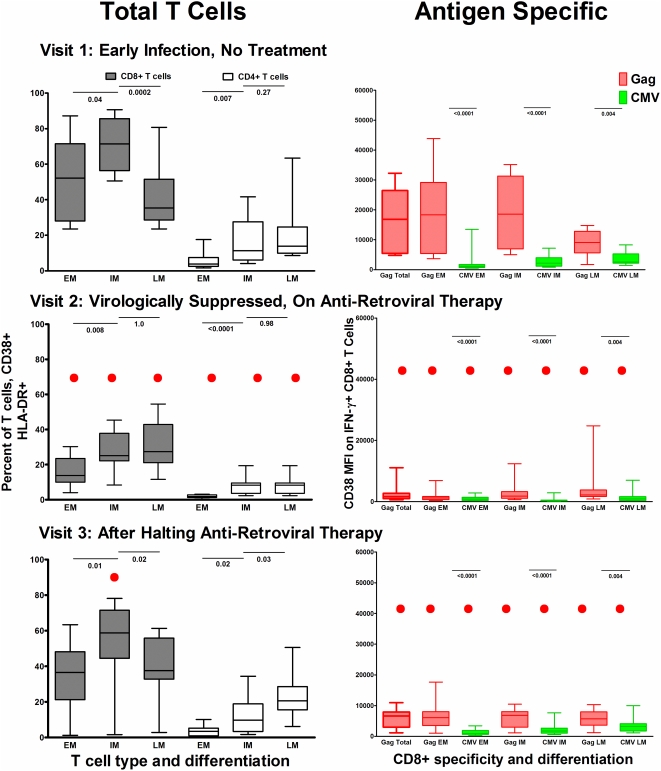
Figure 4. Activation levels on total and antigen specific T cells by differentiation stage.
In the first column the proportion of total T cells (CD8+ and CD4+) expressing CD38 and HLA-DR activation markers by T cell maturation category are displayed and defined as early memory (CD27+CD28+) EM, intermediate memory (CD27+CD28−) IM, and late memory (CD27−CD28−) LM. In columns 2 the CD38 MFI level is shown by maturation stage for CD8+ T cell IFN-γ responses to both HIV-1 Gag (red) and CMV pp65 (green). And in column 3 the CD38 MFI is shown for each maturation stage of CD4+ T cell IFN-γ responses to HIV-1 Gag (red) and CMV pp65 (green). Row 1 displays measurements for visit 1, prior to antiretroviral therapy. Row 2 displays measurements for visit 2, during a virologically suppressive anti-retroviral regimen, and row 3 displays measurements for visit 3, after patients had halted an anti-retroviral regimen and viremia had rebounded. Black bars indicate differences between activation levels by response categories (Wilcoxon 2 Sample Test). Red dots notes a significant change from baseline (visit 1) values (Sign Rank Test).

