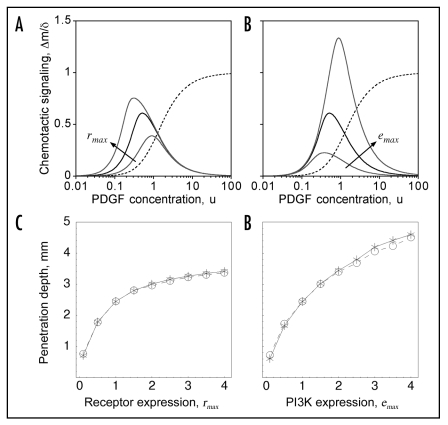
Figure 1.
Chemotactic signaling efficiency depends on PDGF concentration and individual cell properties. (A and B), the intracellular PI3K signaling gradient, Δm, is normalized by the PDGF gradient steepness δ (Eq. 4) as a measure of chemotactic signaling efficiency. The solid black curve shows Δm/δ for the base scenario, with rmax = emax = pmax = 1, and the dashed curve shows r/rmax as a function of u (Eq. 1) on the same scale. (A) the values of rmax are 1/3, 1 and 3, with emax = pmax = 1. (B) the values of emax are 1/3, 1 and 3, with rmax = pmax = 1. (C and D) effect of varying rmax and emax, homogeneously throughout the cell population, on cell invasiveness. As in ref. 11, the maximum depth into the wound where the dimensionless cell density v = 0.5 at t = 10 days is used as a metric of invasion rate. The results show good agreement between the current hybrid model (HM; circles) and the previously published deterministic model (DM; stars).

