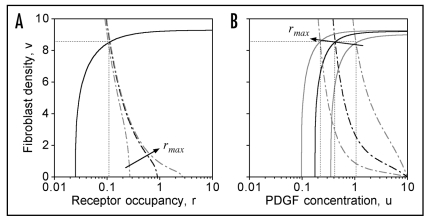
Figure 2.
Under stationary conditions, the cell population tends to maintain a certain value of the mean receptor occupancy r, regardless of the mean rmax. Plotted are the nullclines for zero net cell production (Rp = 0, Eq. 6C; solid curves) and for zero net PDGF production (ks − kuu − kvvr = 0; dot-dashed curves). Their intersection point (dotted lines) determines the steady state in the absence of spatial gradients. The black curves are for the base case, rmax = 1; other rmax values (gray curves) are 0.3 and 3. (A) plotted in (r,v) phase space. (B) plotted in (u,v) phase space.

