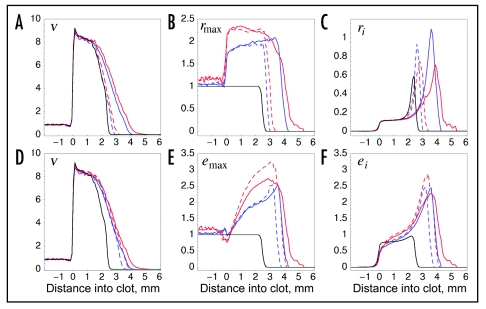
Figure 4.
Distribution of receptor and PI3K expression levels and activities in the wound space. Mean values of the cell density v (A and D) and cell-specific parameters rmax (B) and emax (E) and variables ri (C) and ei (F) are plotted as a function of location in the wound, relative to the dermis-clot interface at x = 0 (t = 10 days, as in Figs. 1 and 3). In the clot, regions containing no cells were assigned values of zero, and the results are averaged over 50 simulations. The black curve is the base case (σ = 0), blue curves were obtained using sampling model II with σ = 0.3 (lognormal distribution), and red curves were obtained using sampling model III with σ = 1 (lognormal distribution). Solid curves are for the case where both rmax and emax were sampled; dashed curves are for variation of a single parameter, either rmax (A–C) or emax (D–F).

