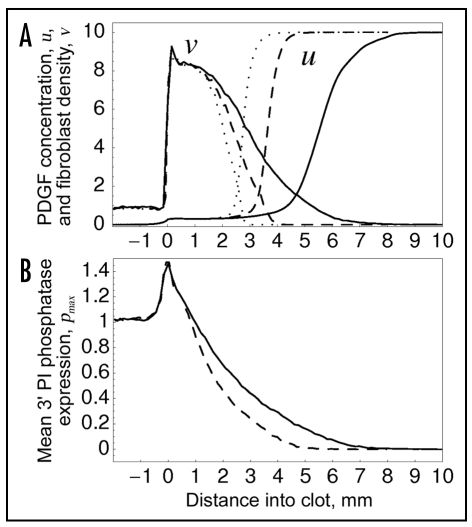
Figure 6.
Variability in PI3K and 3′ PI phosphatase expression results in broadening of the fibroblast density and PDGF concentration profiles. Sampling model II, with lognormal distribution and σ = 0.25, was used. (A) spatial profiles of PDGF concentration and fibroblast density. Individual cell parameters were varied as follows: rmax only (dotted curves), rmax and emax (dashed curves), or rmax, emax and pmax (solid curves). (B) spatial profile of mean pmax value, with variation of pmax only (dashed curve) or all three of rmax, emax and pmax (solid curve).

