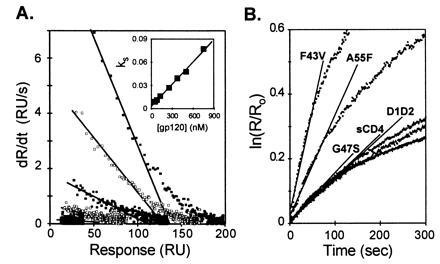
Figure 2.

Kinetic analysis. (A) A linear transformation of the association phase data for gp120 binding to a sCD4 surface. The straight lines are a linear least squares fit to the response data (□ and ▪) acquired at the selected gp120 concentrations of 750, 375, 125, and 50 nM. The ks values determined from these slopes were replotted versus gp120 concentration shown in the Inset (○), providing the on rate constant. (B) A linear transformation of the dissociation phase data for the highest concentration of gp120 injected over each form of CD4 surface. The slope of the straight line, labeled for each CD4 surface, was fit to the initial 90 sec of the transformed dissociation phase data and provided the off-rate constant.
