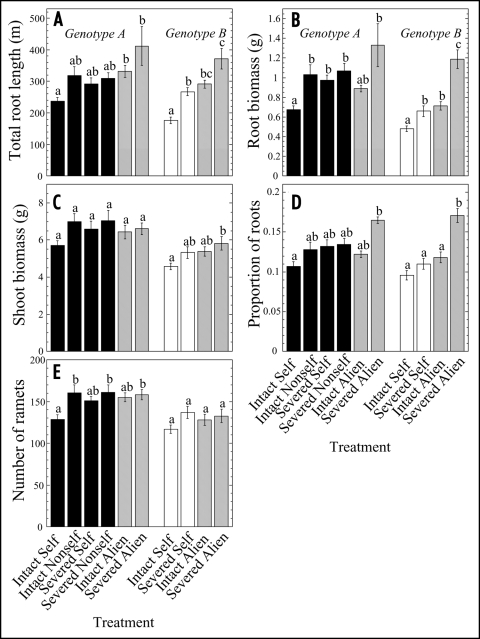
Figure 2.
Effects of self/non-self discrimination in Trifolium repens in Experiment 1 as expressed by total root length (A), root biomass (B), shoot biomass (C), proportion of total plant biomass allocated to roots (D) and number of ramets (E) of two different genotypes (A and B). Treatments are explained in Figure 1. Values given are means (± S.E.) per plant, the two originally connected ramets together (n = 12–16).

