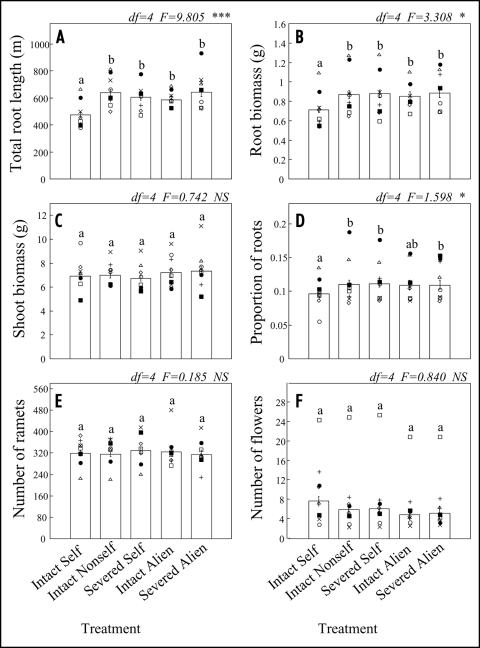
Figure 3.
Effects of self/non-self discrimination in Trifolium repens in Experiment 2 as expressed by total root length (A), root biomass (B), shoot biomass (C), proportion of total plant biomass allocated to roots (D), number of ramets (E) and number of flowers (F). The treatments are explained in Figure 1. Each symbol represents the mean value of a single genotype (n = 3–10). The genotypes also used in the Experiment 1 are indicated by the symbols solid circle (genotype A) and solid square (genotype B). The bars represent the mean (± S.E.) per plant (i.e., the two originally connected ramets together) averaged over all eight genotypes. The letters denote Tukey HSD grouping, based on a model in which genotypic differences are ignored. Table 1 gives the results of a 2-way ANOVA with treatment and genotypes as independent factors.

