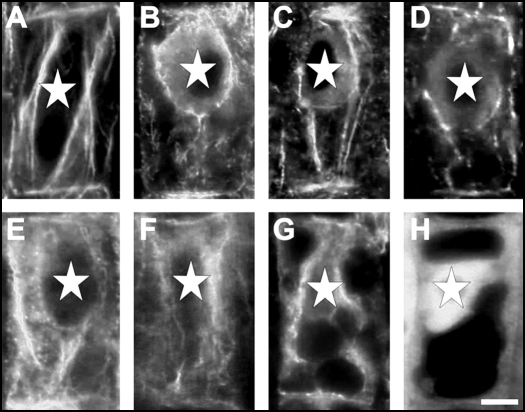
Figure 7.
F-Actin arrangements in cells of the transition zone. (A) Control. (B) BFA treatment. (C) TIBA treatment. (D) NPA treatment. (E) Flurenol treatment. (F) Chlorflurenol treatment. (G) Chlorflurenolmethyl treatment. (H) Latrunculin B treatment. Note the depletion of F-actin from end-poles and disintegration of F-actin cables while nuclei are shifted from their original central position towards the basal cell pole. Bar: 8 µM.

