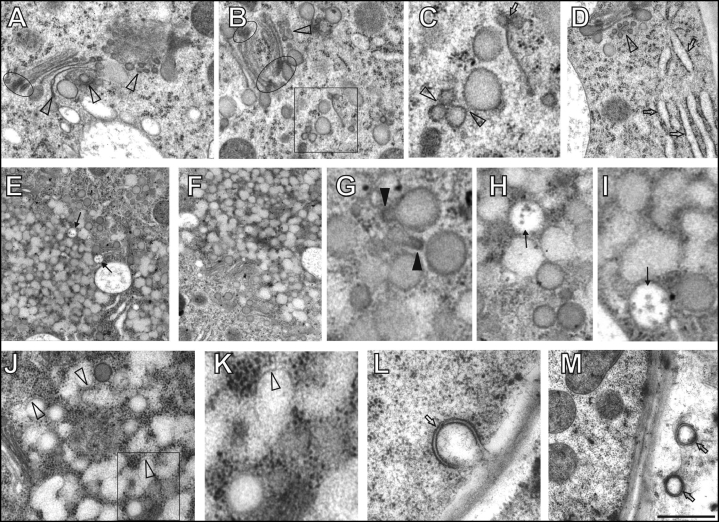
Figure 2.
Maize root epidermis cells treated with brefeldin A (BFA) for 10–30 minutes. (A–D) After 10 minutes of BFA treatment, progressive degradation of trans Golgi cisternae via vesiculation (arrowheads in A, B and D) and bending was obvious (A). Boxed area in B is presented as C. Note that occasionally trans Golgi cisternae can be lost (C, arrow) and inflated ER elements appear early after BFA treatment (D, arrows). Elipses in A and B highlight prominent dense coating of edges of cis and median Golgi cisternae. (C) Coated vesicles enhanced their contacts and fusion events (arrowheads). (E–I) 20 minutes of BFA treatment. (E–F) Note progressive fusions of TGN/PGN vesicles in the centre and periphery of BFA compartments while MVBs retain their structural identity (arrows in E). Note accumulation of Golgi stacks surrounding BFA-induced compartments in F. (G) Fusing TGN/PGN vesicles typically show pear-shaped forms with coated protrusions (filled arrowheads). (H,I): Detail views of fused TGN/PGN vesicles and unfused MVBs (arrows). (J–M) 30 minutes of BFA treatment. Boxed area in J is presented as K. (J,K) Most of the TGN/PGN vesicles fuse together extensively and almost lose their identity as well as coatings (empty arrowheads). (L,M) Autophagosome-like compartments enclosed with double-membranes (arrows). Bar = 0.73 µm for A and M; 0.65 µm for B; 0.26 µm for C and I; 0.80 µm for D; 1.35 µm for E; 1.25 µm for F; 015 µm for G; 0,40 µm for H; 0.50 µm for J; 0.20 µm for K and 0.27 µm for L.

