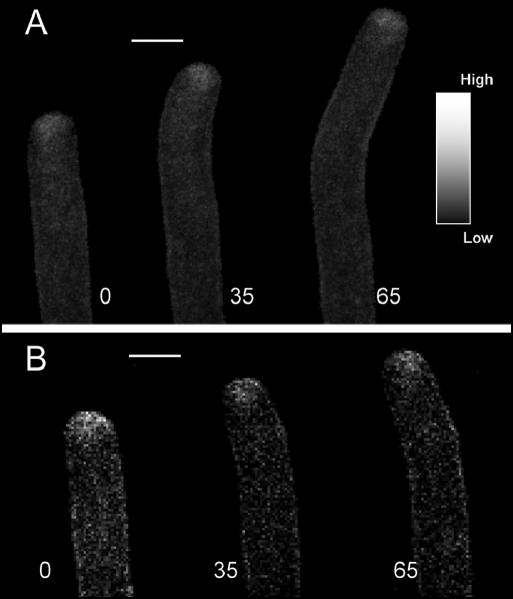
Figure 1.
Time course confocal images of A. umbellatus pollen tube labelled with FM dyes undergoing reorientation of the growth axis. (A) FM1–43. (B) FM4–64. With both dyes, the typical apical hotspot is visible. During changes in the growth axis, asymmetric distribution of fluorescence within the apical dome can be measured. The times (sec) at which the images were taken are indicated next to the images. Scale bar = 10 µm.

