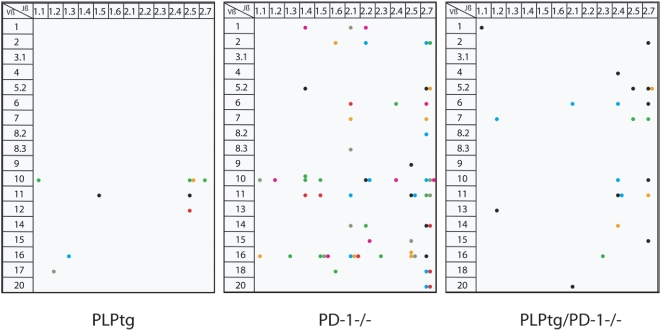
Figure 3. Spectratyping of CNS derived lymphocytes.
- Lymphocytes from the CNS of 12 months old PLPtg (n = 7, as adopted from [4], PD-1-/- (n = 7), and PLPtg/PD-1-/- (n = 4) mice were analysed for disturbances in the T-cell receptor repertoire by spectratyping. Clonal expansions (visible as single peaks in the fragment analysis) are shown as colored dots (different colors indicate individual animals). The expanded T-cells are characterized by their Vβ- and Jβ-chains. The clonal expansions occurred widely distributed over different Vβ and Jβ regions, although some domains seemed to be prone for clonal expansions in different mutant mice. Note that different numbers of experimental mice contribute to the different numbers of dots.

