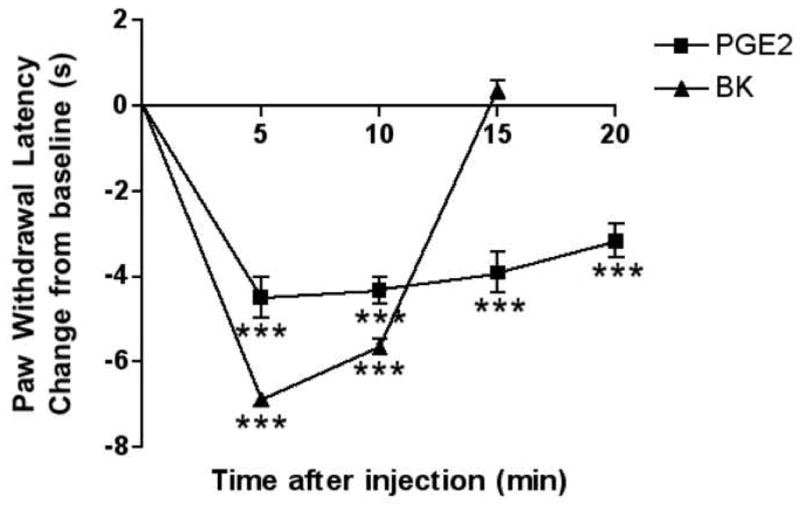
Fig. 1. Time course of bradykinin- and PGE2-induced thermal allodynia.

Bradykinin (BK; 25 μg) or PGE2 (0.3 μg) was injected i.pl. in 50 μl saline. PWLs were measured at 5 min intervals for at least 15 min post-injection. Baseline PWLs were 9.75 ± 0.40 s. Data are expressed as mean ± S.E.M. of 5–9 animals per group (Note: Error bars for some data points are within the size of the symbol). ***, P<0.001 vs. vehicle treated controls (not shown). All observations were collected by observers blinded to treatment allocation.
