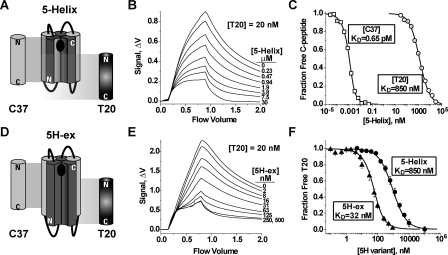
FIGURE 2.
C-peptide binding properties of 5-Helix and 5H-ex. A and D, schematic diagrams of 5-Helix (A) and 5H-ex (D). The N-HR (dark gray) and C-HR (light gray) segments are shown as cylinders, whereas the Gly/Ser linkers are represented by black lines. The black oval in the C-peptide binding site indicates the location of the deep hydrophobic pocket at the N-HR C terminus. The cylinders labeled C37 and T20 show the extent of the binding site of each C-peptide. The N and C designate the N and C termini for each polypeptide. B and E, fluorescence response as equilibrated mixtures of f-T20 (20 nm), and either 5-Helix (B) or 5H-ex (E) were washed through the Kinexa 3000 flow fluorimeter. The instrument flow cell contained beads that specifically captured free (unbound) f-T20. The difference in fluorescence signals (Δf) measured before sample load (0 ml) and after the sample washout (2 ml) was proportional to the free f-T20 concentration in reaction mixtures (see “Experimental Procedures”). C and F, titrations of fluorescent C37 (2.5 pm) and T20 (20 pm) with either 5-Helix or 5H-ex. In C, R-C37 (squares) and f-T20 (circles) were titrated by 5-Helix, whereas in F, f-T20 was titrated by either 5-Helix (circles) or 5H-ex (triangles). The fraction of unbound C-peptide was calculated by normalizing each Δf to a minimum and maximum Δf obtained from samples in which the C-peptide is fully bound or fully unbound. The KD values were determined by fitting these data to a bimolecular equilibrium binding model (solid lines).

