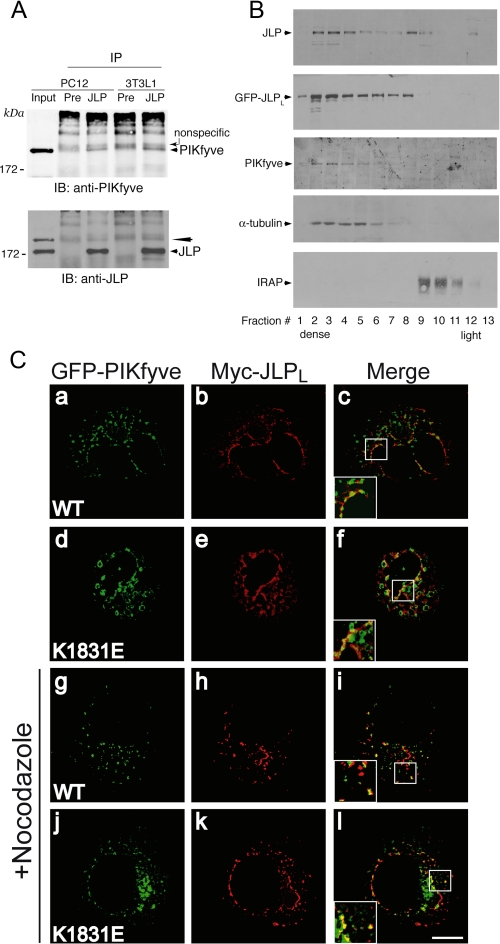
FIGURE 4.
JLP interacts, cofractionates, and colocalizes with PIKfyve. A, equal protein amounts of fresh 0.1% Triton X-100 cell extracts derived from PC12 cells or 3T3L1 fibroblasts were immunoprecipitated with the preimmune serum from the JLP antibody production or anti-JLP antiserum as indicated. Washed immunoprecipitates (IP) along with the input of PC12 lysates (200 μg, representing 4% of cell protein subjected to immunoprecipitation) were resolved by SDS-PAGE and immunoblotting (IB) with the indicated antibodies, with a stripping step in between. PIKfyve coimmunoprecipitation is apparent only in the anti-JLP immunoprecipitates but not in that with preimmune serum (arrowhead). The denoted broad bands seen above the coimmunoprecipitated PIKfyve band are nonspecific, originating from the IgGs. The PIKfyve band is not fully stripped and is still seen in the JLP blot (long arrowhead). Shown are chemiluminescence detections of immunoblots from a representative experiment of three independent experiments for each cell line with similar results. B, the HEK293 cell line stably expressing HA-PIKfyveWT with or without transient coexpression of eGFP-JLPLWT was fractionated into total membranes and cytosol. Membrane fractions were subjected to equilibrium sedimentation in 30% iodixanol. Fractions were collected and analyzed by SDS-PAGE and immunoblotting with antibodies against the indicated proteins. Shown are chemiluminescence detections of blots from representative fractionations in eGFP-JLPLWT-expressing or non-expressing cells representative of four independent fractionations with similar results. C, COS7 cells were cotransfected with pCMV5-Myc-JLPLWT and either pEGFP-HA-PIKfyveWT or pEGFP-HA-PIKfyveK1831E. Twelve hours post-transfection cells were treated with nocodazole (30 min, 10 μm, 37 °C), or were left untreated as indicated, and then fixed and permeabilized. Expressed Myc-JLPLWT was detected with anti-Myc monoclonal antibody followed by Alexa568-conjugated anti-mouse IgG (panels b, e, h, and k). Expression of eGFP-PIKfyve was visualized by the GFP fluorescence (panels a, d, g, and j). Cells were viewed by confocal microscope (Olympus 1X81), and images were subjected to deconvolution analyses as described under “Experimental Procedures.” Panels on the right (c, f, i, and l) are the overlay of the deconvolved leftward images of the same Z-level through the middle of the cell. Insets represent computer-enlarged images of the boxed areas depicting a colocalization (yellow) of JLPLWT with PIKfyveWT or PIKfyveK1831E. Shown are typical images from two to three independent experiments. Bar, 10 μm.

