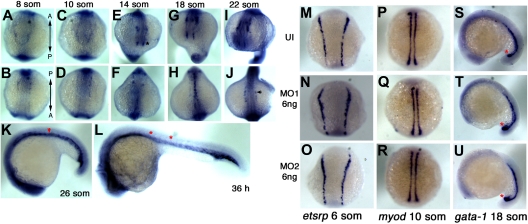
Figure 1.
Whole-mount ISH expression pattern of dusp-5 and effect of in vivo knockdown of dusp-5 on etsrp+ cells in the ZF embryo. (A-L) Whole-mount ISH using dusp-5 antisense probes, with the embryo stages depicted on top of or inside each panel. (A,C,E,G,I) Top panels: Top views of the anterior embryo regions. (B,D,F,H,J) Dorsal views of the head and trunk regions. (K,L) Lateral views of the embryo with the head to the left. (M-O) etsrp, 6 som, (P-R) myod, 10 som, and (S-U) gata-1, 18 som show ISH embryos stained for indicated markers. (M,P,S) UI embryos. (N,Q,T) 6 ng of MO1-injected. (O,R,M) 6 ng of MO2 injected embryos. “A” and “P” labels denote the direction of the anterior-posterior axis in panels A and B. Black asterisk in panel E indicates head dusp-5+ populations; arrowhead in panel J, dusp-5+ angioblasts in LPM; red asterisks in panel K, dusp-5+ angioblasts coalescing to form axial vessels, in panel L (intersomitic vessels) and in panels S to U (gata-1+ cells in blood islands).

