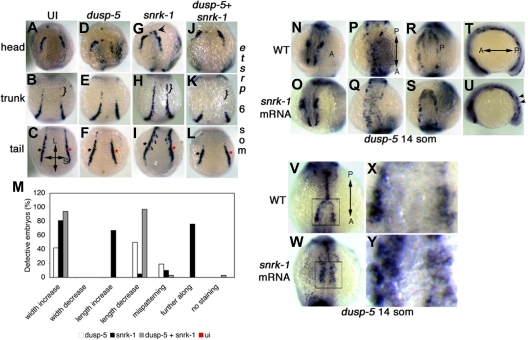
Figure 3.
Snrk-1–induced ectopic induction of etsrp+ angioblasts is blocked by dusp-5. (A-L) etsrp ISHs at 6 som. (A-J, B-K, and C-L) etsrp+ head, trunk, and tail populations, respectively. Dusp-5 mRNA-injected embryos (D-F), compared with UI embryos (A-C), show decreases in the length and width of the tail etsrp+ population (compare red asterisk in panels C and F). Snrk-1 mRNA-injected embryos show increases in all 3 etsrp+ populations (compare black arrow in panel G, bracket in panel H, and asterisks in panel I). Furthermore, the direction of etsrp+ cell migration (black arrows in panel I) is toward the midline. Embryos injected with both dusp-5 and snrk-1 mRNA (J-L) show the most dramatic decrease in etsrp+ populations across the longitudinal and short axes of the embryo. (M) Quantification of the different phenotypes observed in UI (ui, n = 25), single mRNA-injected (snrk-1, n = 21 or dusp-5, n = 26), or combination-injected embryos (snrk-1 + dusp-5, n = 31). (N-U) dusp-5 ISH embryos in UI wild-type (WT) (N-T) and snrk-1 mRNA-injected embryos (O-U) at 14 som. High power images of the boxed region in panel V (WT) and panel W (snrk-1 mRNA) are shown in panels X and Y, respectively. (N,O) Minimal differences in dusp-5 ISH in the head. (P) Properly migrated dusp-5+ cells that make a distinguishable “Y”-shaped pattern; this pattern is not seen in the trunk region of snrk-1 mRNA-injected embryos (Q). Little difference is noted in the tail region between WT (R) and snrk-1 mRNA-injected embryos (S). Further, snrk-1 mRNA-injected embryos (U) appear further along developmentally compared with WT embryos (T) in the lateral view, and dusp-5+ cells are observed on a different plane in snrk-1 mRNA-injected embryos (black arrows in panel U). In high-power images of snrk-1 mRNA-injected embryos (Y), the patterning of dusp-5+cells is affected compared with similar regions in WT embryos (X), and they also appear closer to the midline in snrk-1 mRNA-injected embryos with more diffuse distribution. “L” and “S” labels in panel C denote longitudinal and short axes, respectively, for panels A to L. “A” and “P” labels in panels N, P, R, T, and V denote the direction of the anterior-posterior axis in corresponding panels (N-Y).

