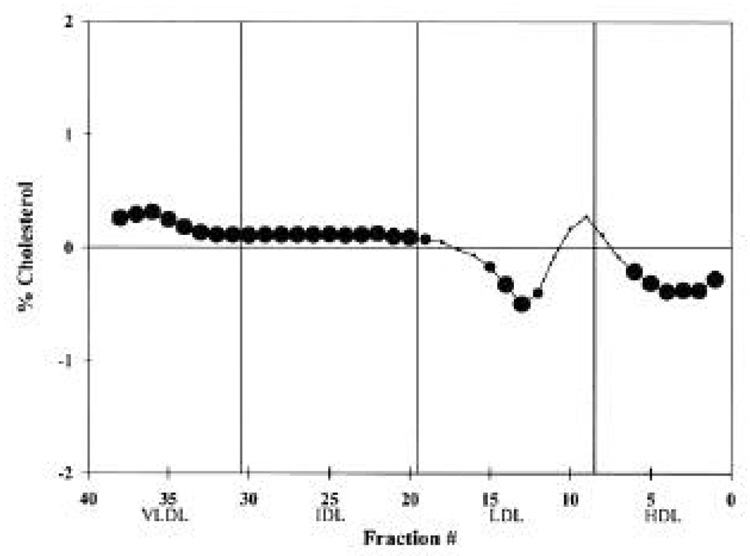
Figure 1.

Difference plot comparing the mean lipoprotein levels of each normalized fraction from the DGUC for the microalbuminuric group (n = 80) versus the normoalbuminuric group (n = 1,056). If the difference is positive, the microalbuminuric cholesterol value is greater than the normoalbuminuric value. │, standard density-gradient fractions with HDL located in fractions 1–8, LDL in fractions 9–19, IDL in fractions 20–30, and VLDL in fractions 31–38 (36). For a fractional difference, , P ≤ 0.05;
  , 0.05 < P ≤ 0.10; ●, not significant.
