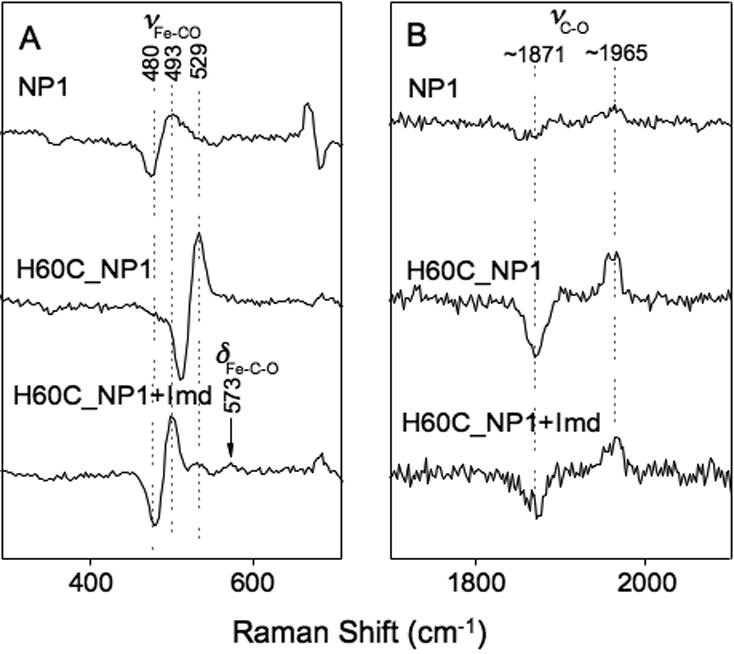
Figure 6.

Fe2+·CO - Fe2+·13C18O resonance Raman difference spectra for NP1 and H60C_NP1. Panel A, low frequency region showing the Fe-CO stretching vibrational band. Panel B, high frequency region showing the internal C-O stretching vibrational band. H60C_NP1 +Imd represents the difference spectrum measured with 5-fold molar excess of added imidazole.
