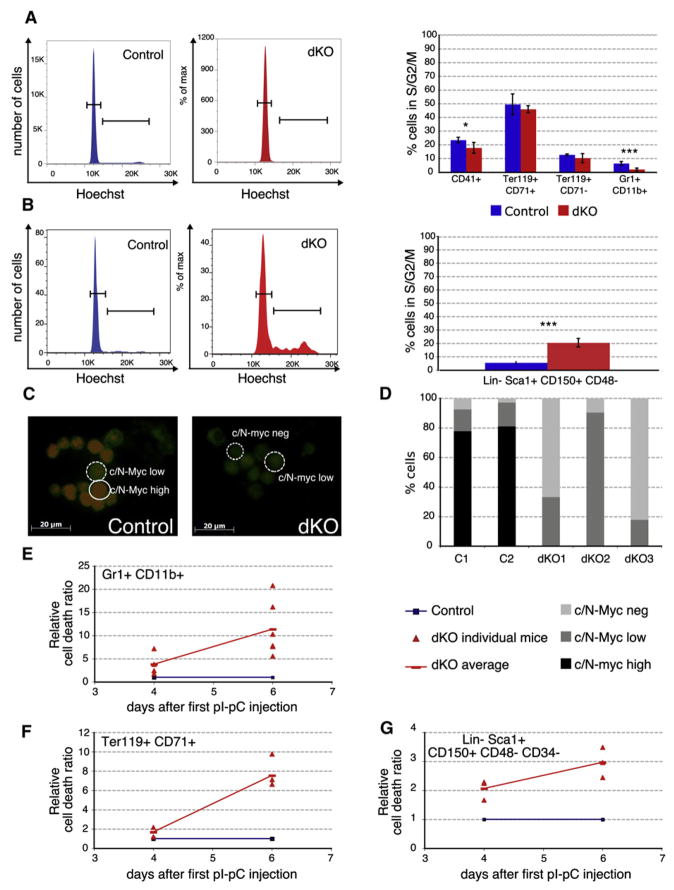
Figure 3. Simultaneous Deletion of c-myc and N-myc Affects Proliferation and Survival of Hematopoietic Cells in a Context-Dependent Manner.
(A and B) Cell-cycle status (DNA content; Hoechst 33342 staining) of control and dKO cells 6 days after pIpC treatment. Representative examples of granulocytic (Gr1+CD11b+) cells (A) and of SLAM-HSCs (Lin−Sca1+CD150+CD48−) (B) are shown in the left panels. Mean percent of cells in S/G2/M phase (±SD) is shown in the corresponding right panel. n = 3.
(C and D) c-Myc/N-Myc expression levels were determined by immunofluorescence on cytospins from FACS sorted BrdU+Lin−Sca1+CD150+ cells. BrdU was administered to the mice via the drinking water 15 hr prior to analysis. Representative pictures are shown in (C), with BrdU in green and c-Myc/N-Myc in red. Scale bar, 20 μm. (D) c-Myc/N-Myc expression levels were blindly scored on two control and three dKO mice. A minimum of 25 cells per genotype was analyzed, and each cell was assigned an intensity of Myc expression as exemplified in (C). Genetic controls for the antibodies used are presented in Figure S6.
(E–G) Quantitative analysis (FACS) of apoptosis (TUNEL) in the granulocyte (E), erythroblast (F), and SLAM-HSC (G) populations. Data represent mean ± SD, n > 3 per time point.

