
Figure 10.
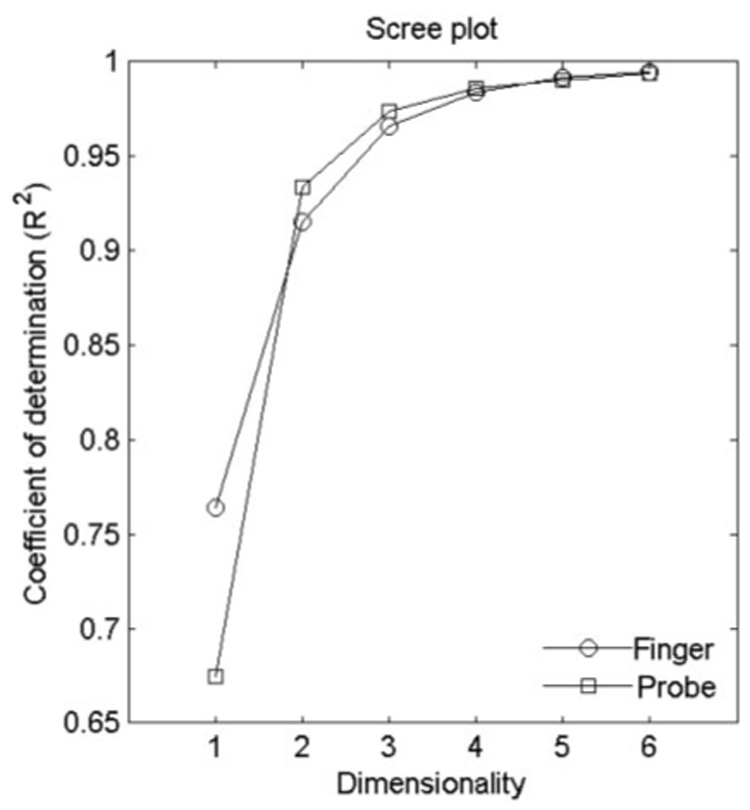
Scree plots illustrating the coefficient of determination R² achieved by an n-dimensional MDS model as a function of the dimensionality of the model for dissimilarity ratings obtained in the finger-scanning (circles) and probe-scanning (squares) conditions. Two or more dimensions are necessary to achieve a good fit in the finger-scanning and probe-scanning conditions at the level above R² = 0.9.