
Figure 11.
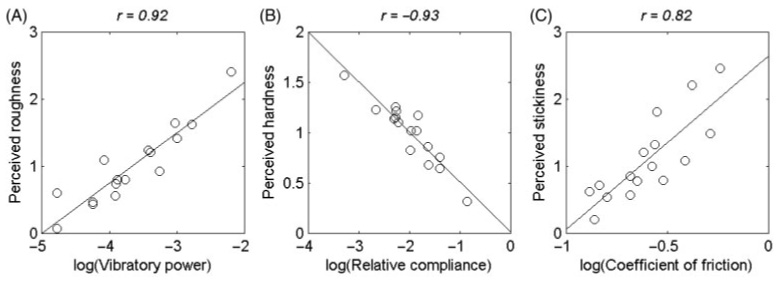
Physical quantities associated with perceived roughness, hardness, and stickiness when exploring textures through probes. (A) Log power of texture-elicited vibrations vs. subjective roughness magnitude. Correlation coefficients between log vibratory power and perceived roughness, hardness, and stickiness were 0.92, 0.04, and 0.23, respectively. (B) Perceived hardness vs. log relative compliance. Relative compliance was given by the ratio between the displacement of a Delrin 3-mm diameter probe into a textured surface and the weight that produced it (in cm/g). Correlation coefficients between log relative compliance and perceived roughness, hardness, and stickiness were 0.43, −0.93, and 0.59, respectively. (C) Perceived stickiness vs. the log coefficient of friction. Correlation coefficients between log coefficient of friction and perceived roughness, hardness, and stickiness were 0.57, −0.54, and 0.82, respectively. Thus, perceived roughness is associated with vibratory information, perceived hardness with relative compliance, and perceived stickiness with friction.