
Figure 8.
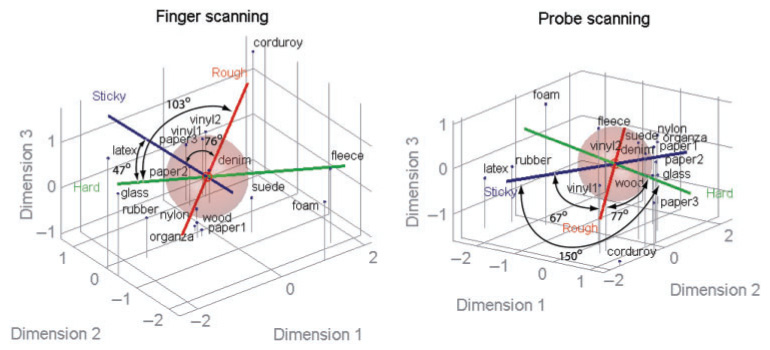
Relative locations of 16 textures are shown in the multidimensional scaling (MDS) space model based on perceived dissimilarity ratings (dark blue dots with vertical gray lines) and their relation to perceived roughness (red line), hardness (green line), and stickiness (dark blue line). Left panel shows a plot in the finger-scanning condition and right panel shows probe-scanning condition. The radii of the spheres represent the overall mean of adjective ratings, and angle values provide the degree of orthogonality between the two adjective axes. These angles were measured between the high ends of the two adjective axes (where the words “Rough”, “Hard”, or “Sticky” are placed). MDS solutions of dissimilarity ratings are based on 3D models in which each axis (Dimensions 1–3) is chosen arbitrarily to attain best fit between the model and normalized ratings. Averaged data over eight subjects in each scanning condition were used. Note a large difference in angle between the hardness and stickiness axes across two modes of scanning (47°: finger scanning, 150°: probe scanning), demonstrating that the correlations of the ratings along these two continua are different across two modes of scanning (Table III).