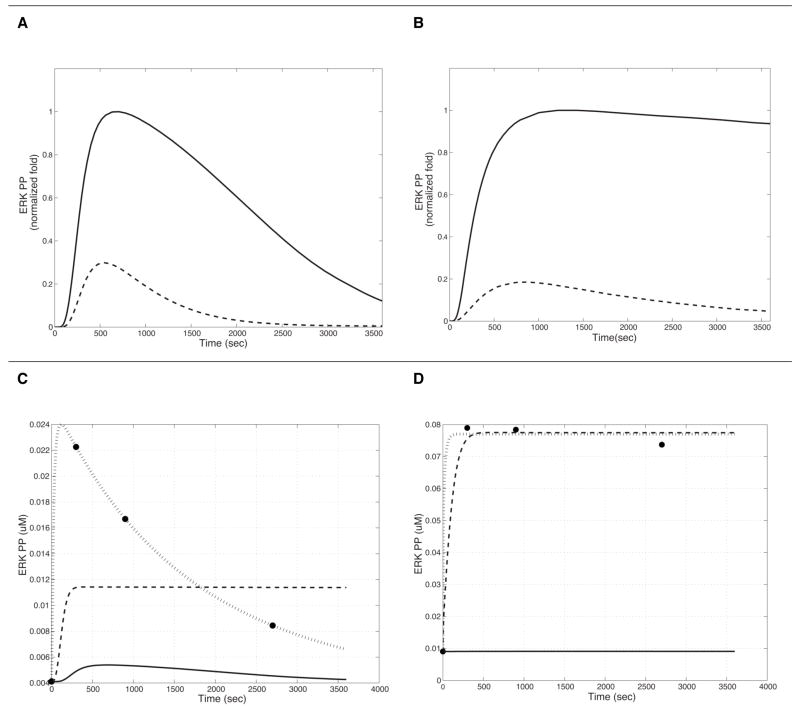
Figure 6.
Simulation of the time-course of MAPK activation in HEK293 cell lines stably expressing human 5-HT1A and 5-HT2A receptors separately. A: Phosphorylated ERK (ERK_PP) production following stimulation of 5-HT1AR by ligands with efficacy values of β=1 (broken line) and β=41 (solid line) in a tissue with J=0.01; B: ERK_PP production following stimulation of 5-HT2AR by ligands with efficacy values of β=1 (broken line) and β=357 (solid line) in a tissue with J=0.6, Results are normalized to the ligand with the highest. Panels C and D represent results of parameter optimization. The circles denote the average experimental values obtained from three experiments in cells expressing both receptors, stimulated with either the 5-HT1A agonist (in C) or the 5-HT2A agonist (D). In both panels, the solid lines represent the initial results, the interrupted lines show the result from optimization of one parameter found to be the most important from the sensitivity analysis (k51 in C; k82 in D). The dotted lines show the results of simulation with the optimized parameters (all parameters with |S| > 0.3 from the sensitivity analysis). The final R2 values for this simulation are 0.983 in 6C, and 0.995 in 6D.

