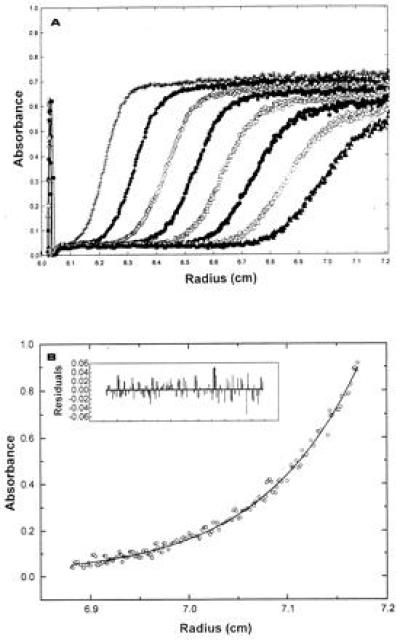
Figure 5.

(A) Sedimentation velocity profile of wild-type TTR in the presence of T4 at pH 4.4. Solute distribution recorded at 235 nm (60,000 rpm). Scans for analysis were recorded every 3 min; for simplicity, only scans from every 15 min are shown. (B) Sedimentation equilibrium analysis of wild-type TTR at pH 4.4 in the presence of 10.8 μM. The solid line drawn through the data was obtained by fitting the absorbance vs. radial position r to Eq. 2 for a homogeneous tetrameric species. The residual difference between the experimental data and the fitted data for each point is shown in the Inset.
