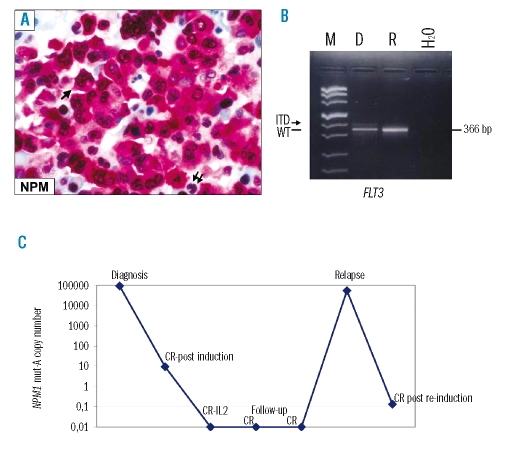
Figure 1.
(A) NPM subcellular expression at diagnosis. Acute myeloid leukemia cells show aberrant cytoplasmic positivity for nucleophosmin (NPM) (arrow) whilst residual hemopoietic cells exhibit a nucleus-restricted positivity for NPM (double arrows). APAAP technique; × 800; hematoxylin counterstaining. (B) FLT3 gene status at diagnosis and relapse. The arrow shows the presence of a faint extra-band corresponding to the FLT3-ITD expressed at low level at diagnosis but not at relapse. The black line indicates the 366bp product corresponding to the amplification of FLT3 wild-type. M: marker; D: diagnosis; R: relapse; H2O=negative control, water line. C) Retrospective quantification of NPM1 mut-A by real time RT-PCR. Variation in NPM1 mut-A transcript level at diagnosis, complete remission (CR) and relapse is shown. The highest transcript copies number was detected at diagnosis and relapse, whereas the transcript copies number decreased following induction and became undetectable during follow-up. After reinduction therapy a reduction of NPM1 mut-A copies number was detected again. IL2 indicates interleukin-2.

