
Figure 3. Dicer1 mutant livers exhibit hepatocyte loss and increased CK19 expression.
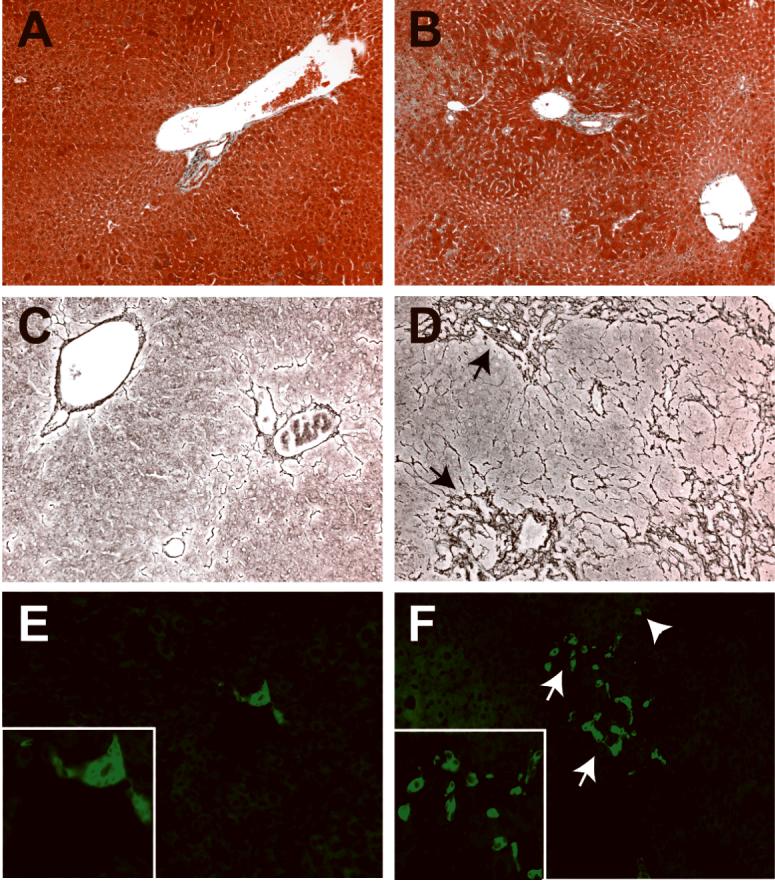
A, C, E: Controls. B, D, F: Mutants. A, B: Trichrome staining of P72 liver sections reveals that despite the pseudonodular appearance of the mutant tissue, no fibrosis is evident at this age. C, D: Reticulin staining of P101 mutant liver sections to highlight the sinusoidal architecture reveals extensive compaction in peri-portal regions (arrows), indicating loss of hepatocytes. E, F: CK19 immunofluorescent antibody staining of P101 liver sections reveals a ductular reaction (arrows), with increased numbers of CK19-positive cells, both in portal areas and occasionally within the lobule (arrowhead). The intensity of CK19 in the mutant sections was increased relative to controls.