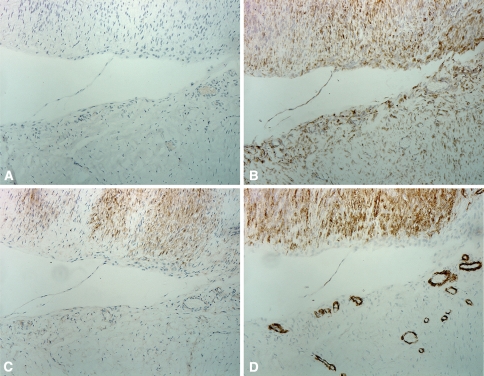
Fig. 3A–D.
Micrographs of neighboring tissue samples in Patient 1-2 show slides (A) without antibody (negative control), (B) vimentin staining fibroblasts (positive control), (C) β-catenin staining myofibroblasts, and (D) α-SMA marking myofibroblast. Histologically, the upper half of the image was identified as a contractile involutional zone with aligned myofibroblasts and the lower half is a proliferative zone with disorganized fibroblasts (Original magnification, ×400).

