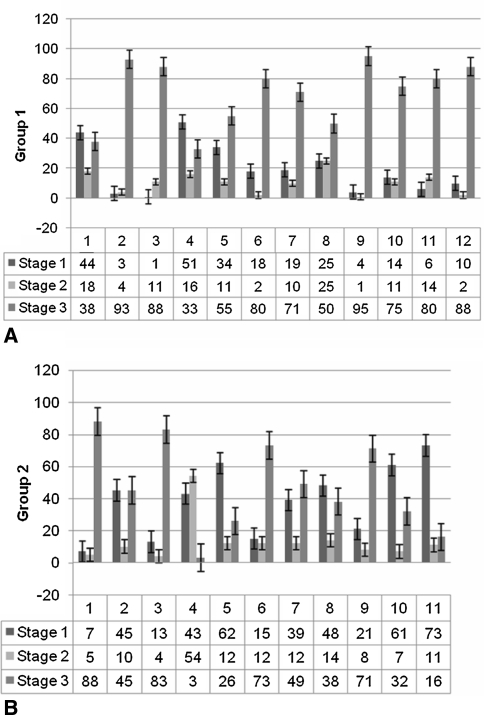
Fig. 4A–B.
The percentages of surface distribution ratio of the three histologic zones on every sample were measured with a geometric matrix in (A) Group 1 without recurrence and (B) Group 2 with recurrent DD. All zones were present in every sample in variable proportions. An overall distribution of 10% proliferative (Stage 1), 30% involutional (Stage 2), and 60% residual (Stage 3) zones was seen. In Group 1, residual zones were somewhat more pronounced, and in Group 2, the involutional zones were more prevalent. Proliferative zones had an equal distribution in both groups.

