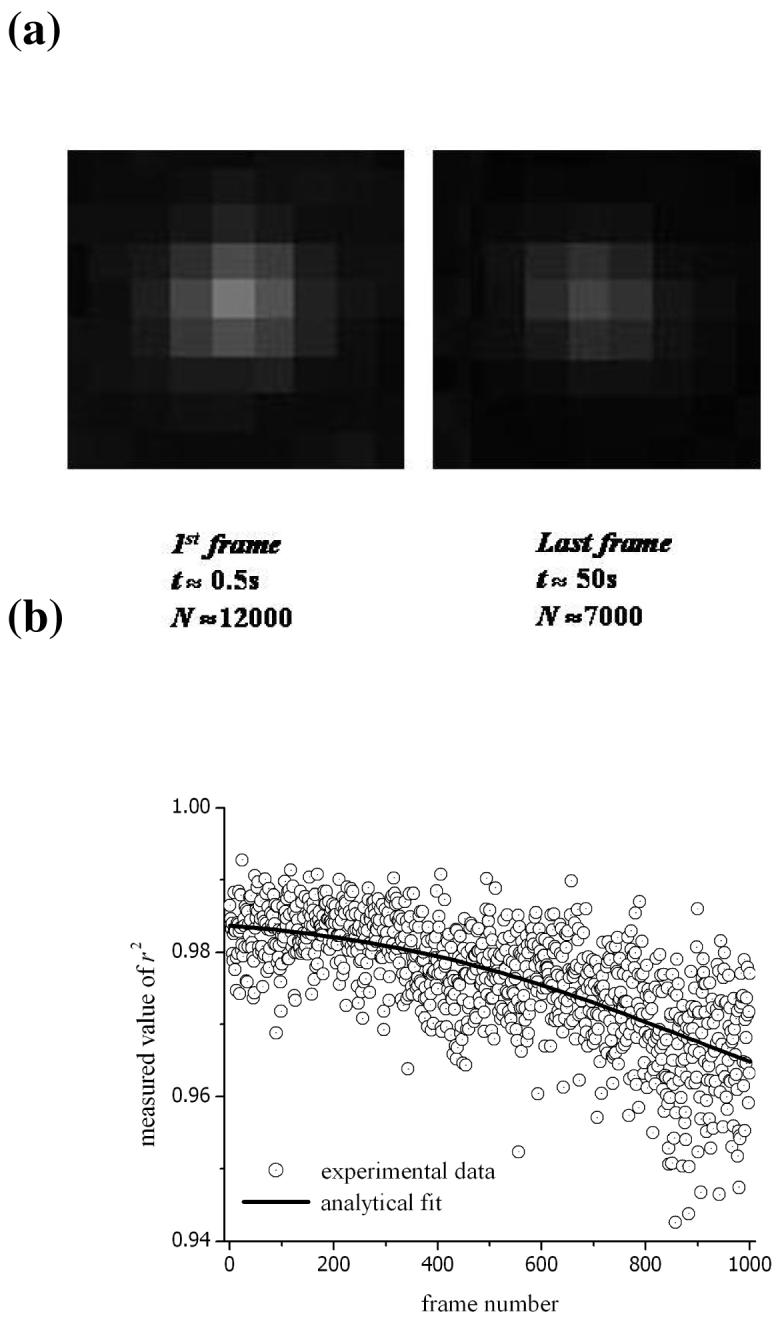
Figure 4.

(a) The fluorescence-intensity profile for ERES labelled with EYFP-tagged proteins. The in vivo images are the first and last obtained in a sequence of 1000 frames. The experimental conditions are described in the main text. The images were generated by 12000 and 7000 incident photons (from fluorescence) collected during a 48ms integration time. (b) The r2 parameter representing the goodness-of-fit was calculated for each frame.
