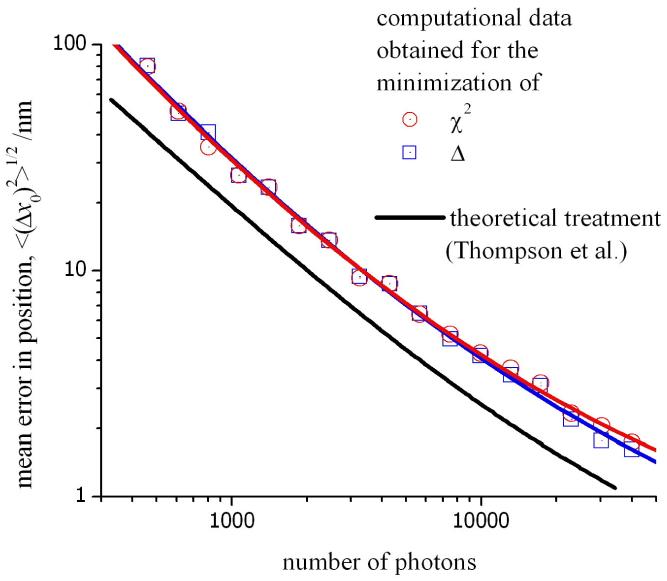
Figure 5.
The mean error in the position of the origin measured using least-squares analysis. The solid line represents a theoretical treatment outlined in ref. 6. The data in red and blue are also theoretical results obtained in this work using a computational model for the measured intensity profile of a point source. The mean error in x0 has been calculated by minimizing χ2 (red) and Δ (blue) respectively; see main text for details.

