Fig.5.

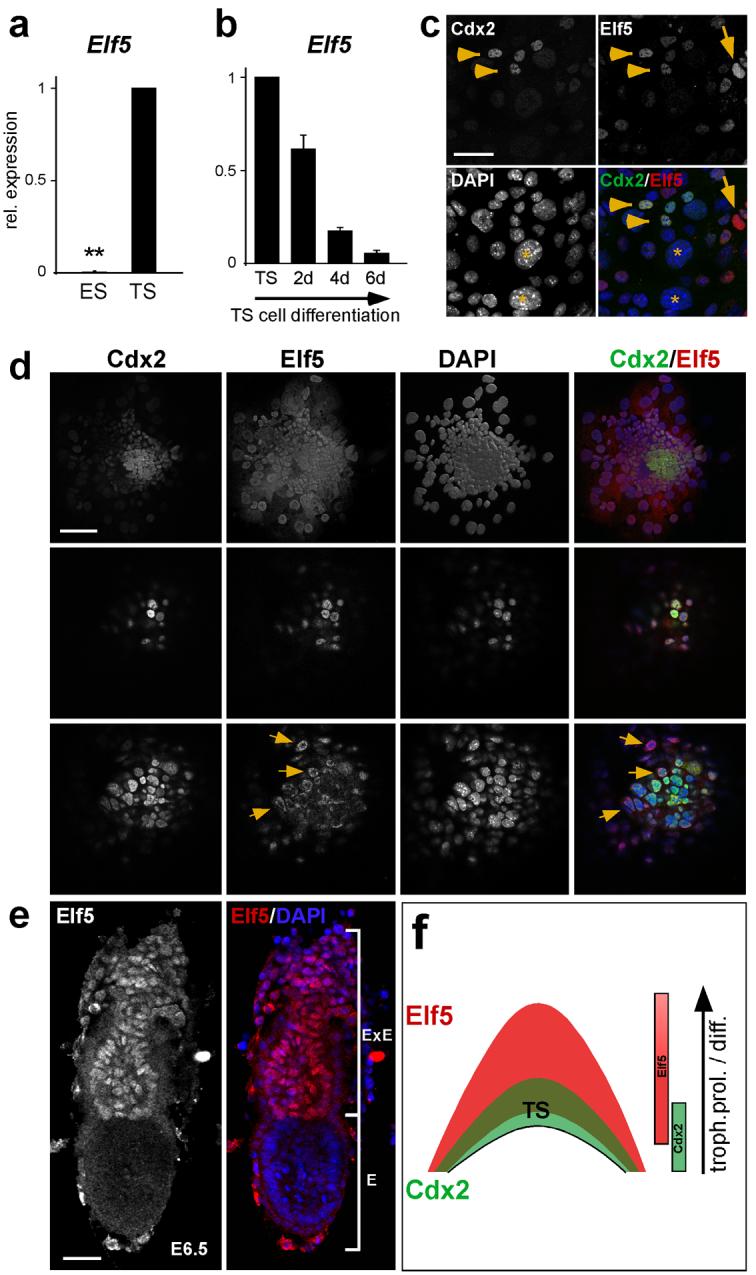
Elf5 is a trophoblast stem cell transcription factor specific to proliferative trophoblast.
(a) Elf5 is not expressed in ES cells but exhibits high expression levels in TS cells (Data are mean ± s.d., **P=1.12E-12; n=3). (b) Elf5 expression is specific to the stem cell state of TS cells and is down-regulated upon differentiation of TS cells. (c) Double immunofluorescence staining for Elf5 and Cdx2 on cultured TS cells shows co-localization of both transcription factors in most stem cells (arrowheads). Some diploid trophoblast cells only express Elf5 (arrow), while giant cell nuclei are mostly negative for both factors (asterisks). (d) Characterization of Elf5 expression in blastocyst outgrowths. Selected confocal section planes are shown. Compared to Cdx2, Elf5 marks a larger population of trophoblast cells (top row). A few central cells only express Cdx2, followed by a core of double positive trophoblast stem cells (middle row). Elf5 staining extends beyond this core into surrounding trophoblast cells (bottom row). Nuclear localization adopts a cortical distribution where diploid trophoblast starts to differentiate into giant cells (arrows). Giant cells are devoid of nuclear Elf5. (e) Whole mount staining of an E6.5 embryo for Elf5. Elf5 expression is strictly trophoblast lineage-specific and is confined to the extraembryonic ectoderm (where trophoblast stem cells are located) and to the ectoplacental cone. E=embryonic portion, ExE=extraembryonic portion. (f) Schematic diagram representing the temporal and spatial distribution of Cdx2 and Elf5. A small Cdx2+ population is overlaid by a Cdx2+ Elf+ trophoblast stem cell core. Elf5 extends from there into the surrounding diploid trophoblast population that undergoes proliferation (prol.) and differentiation (diff.) at the margins of the ectoplacental cone. Scale bar in c represents 50 μm, scale bars in d and e represent 100 μm.
