
Figure 1.
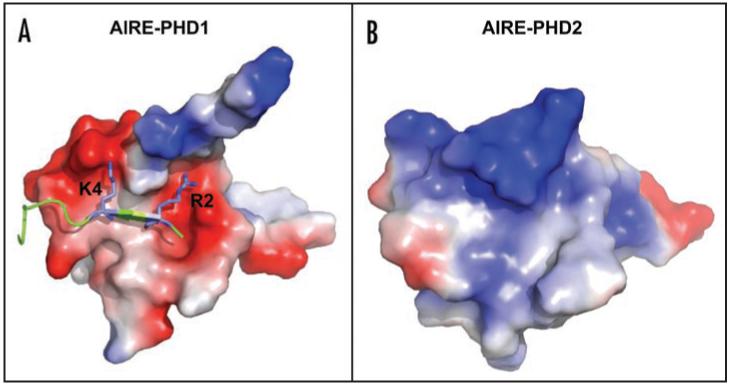
Electrostatic surface plots of AIRE1-PHD1 in complex with H3K4me0 (A) and of AIRE1-PHD2 (B). Blue and red colors indicate positive and negative electrostatic surface potentials, respectively. H3K4me0 peptide is represented in blue, the side-chains of K4 and R2 are explicitly shown in Blue. The model of AIRE-PHD1 in complex with H3K4me0 has been generated as described in Org et al.30 The model of AIRE-PHD2 has been generated as described in Bottomley et al.15