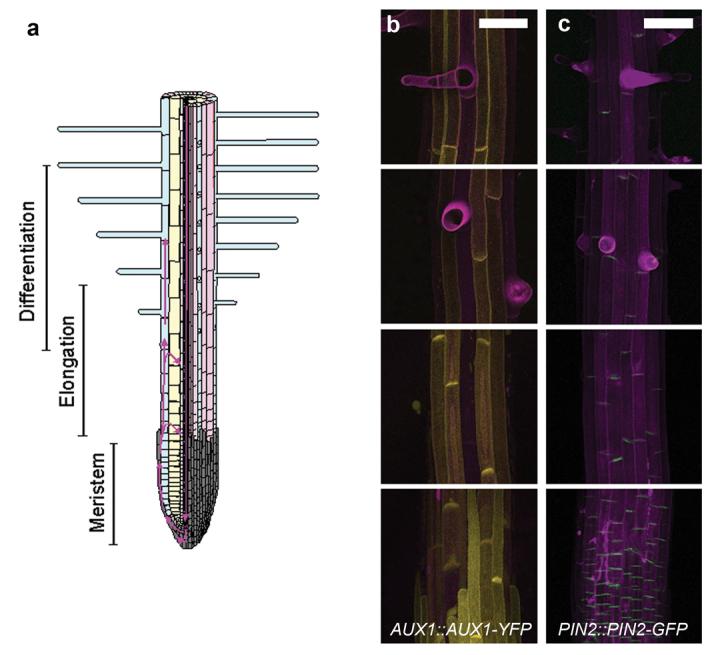
Figure 1. AUX1 and PIN2 expression in hair and non-hair epidermal cells.

(a) Schematic diagram showing tissue organization and developmental zones of the Arabidopsis root. The left-hand side shows a longitudinal section. The right-hand side of the image shows a surface view of the root. Note that the differentiation zone overlaps the proximal end of the elongation zone. Root-hair cell files are shown in blue and non-hair cell files in pink. The root cap is shown in grey. Direction of auxin flow is shown in magenta 2. (b-c) Confocal fluorescent imaging of auxin transporters in the developing root. From top to bottom images are representative of the expression pattern in the late differentiation zone, early differentiation zone, elongation zone and root cap. Cell walls are stained with propidium iodide (magenta). Scale bars represent 50 μm. (b) Expression of AUX1::AUX1-YFP (yellow). (c) Expression of PIN2::PIN2-GFP (green).
