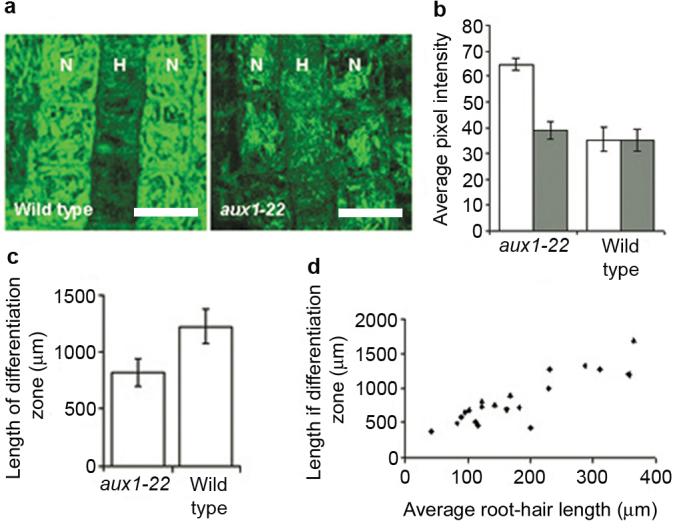
Figure 5. DR5::GFP expression and root-hair growth dynamics support the model auxin distribution.

(a) Confocal fluorescent image of wild-type and aux1-22 roots carrying DR5::GFP after 4 hours treatment with 1 μM IAA. Non-hair cell files are indicated as N and hair-cell files are indicated as H. Scale bars represent 25 μm. (b) Graph showing the average pixel intensity of GFP signal in wild-type and aux1-22 plants expressing DR5::GFP. White bars represent non-hair cells, grey bars represent hair cells. Averages represent measurements from 4-6 roots. Error bars represent 95 % confidence intervals (n = 50-70 cells). (c) Average length of differentiation zone in wild type and aux1-22. Error bars indicate 95 % confidence intervals (n=20) (d) Relationship between average root-hair length and length of differentiation zone of aux1-22 roots.
