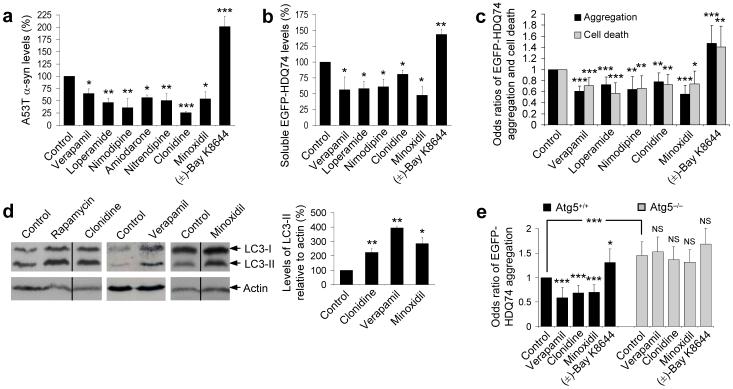
Figure 1. Identification of autophagy-inducing drugs.
a, Densitometric analysis relative to actin of A53T α-synuclein clearance in stable inducible PC12 cell line expressing A53T α-synuclein. Transgene expression was induced with doxycycline for 48 h, and then switched off (by removing doxycycline) with drug (all 1 μM) or DMSO (vehicle control) treatment for 24 h. Control condition is set to 100%. Error bars: standard error of mean.
b, Densitometric analysis relative to actin of soluble EGFP-HDQ74 clearance in stable inducible PC12 cell line expressing EGFP-HDQ74. Transgene expression was induced with doxycycline for 8 h, and then switched off (by removing doxycycline) with drug (all 1 μM) or DMSO (vehicle control) treatment for 96 h. Control condition is set to 100%. Error bars: standard error of mean.
c, SK-N-SH cells transfected with EGFP-HDQ74 construct for 4 h were treated with drugs (all 1 μM) or DMSO (vehicle control) for 48 h post-transfection. The proportions of EGFP-positive cells with aggregates or cell death were expressed as odds ratios and the control was taken as 1. Error bars: 95% confidence interval.
d, PC12 cells were treated with clonidine, minoxidil and verapamil (all 1 μM) or DMSO (vehicle control) for 24 h. Endogenous LC3-II levels were detected with anti-LC3 antibody and quantified relative to actin. Rapamycin (0.2 μM) was positive control. Error bars: standard error of mean.
e, The proportions of EGFP-positive cells with EGFP-HDQ74 aggregates in wild-type (Atg5+/+) and knockout (ATG5−/−) Atg5 mouse embryonic fibroblasts, transfected with EGFP-HDQ74 for 4 h and then treated for 48 h with drugs (all 1 μM) or DMSO (vehicle control). Error bars: 95% confidence interval. ***, p<0.001; **, p<0.01; *, p<0.05; NS, Non-significant.

