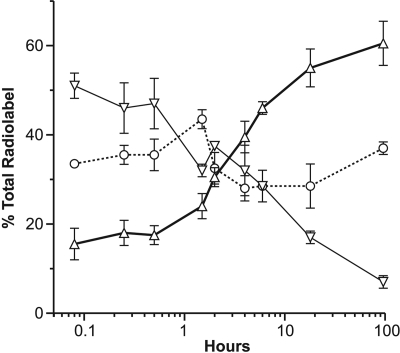
Fig. 3.
Metabolism of [3H]tasidotin by CA46 Burkitt lymphoma cells over time. Cells were incubated for the indicated times with 1.0 μM [3H]tasidotin, and soluble radiolabel was evaluated by HPLC and flow detector analysis. Radiolabel in the three peaks was quantitated at each time point, as indicated by the following symbols: ▿, tasidotin; ▵, P5; and ○, proline. Three independent experiments were performed, and standard deviations are indicated.

