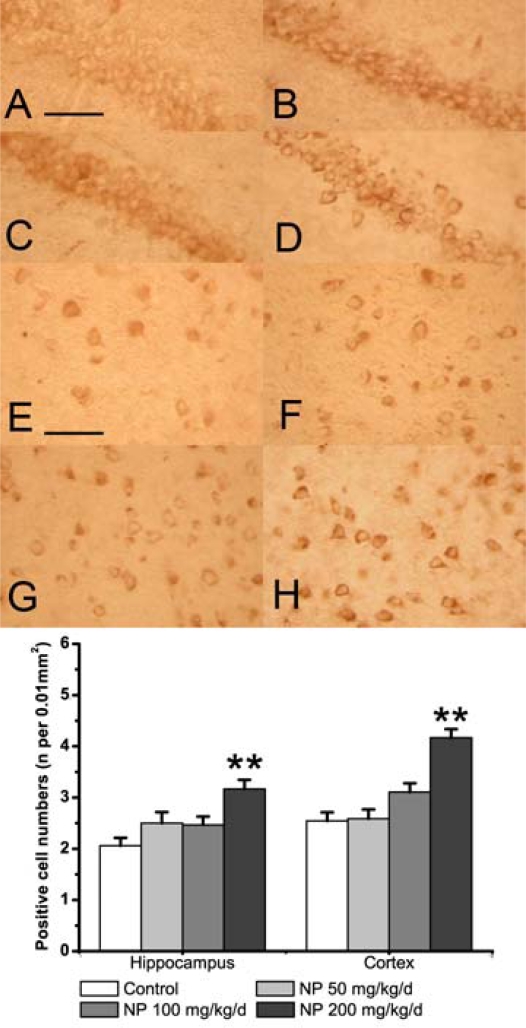
Figure 3.
The effect of NP on the expression of iNOS as determined by immunohistochemistry in the hippocampus (A-D) and cortex (E-H). (A, E) Vehicle control. (B, F) NP 50 mg/mL per day group. (C, G) NP 100 mg/mL per day group. (D, F) NP 200 mg/mL per day group. Scale bars (A–H): 100 μm. The bands below show the number of iNOS positive cells in the hippocampus and cortex. Values are expressed as mean ± S.E.M. (n = 9). **P < 0.01 vs. the vehicle control.

