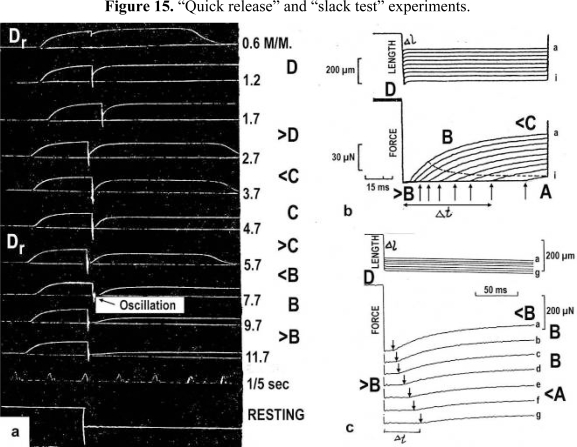
Figure 15.
“Quick release” and “slack test” experiments.
(a) Quick releases on tension recorded in maximal isometric tetanus of frog’s sartorius muscle. The quick release amplitudes are shown in mm (from Gasser and Hill [216]). The approximative twisting stages of the Z-filaments are indicated, and the position of oscillations is denoted. (b) Nine slack test experiments on a skinned rabbit fibre (fibre length 2000 μm, sarcomere length 2.5 μm). From Galler and Hilber [217]; with kind permission of Springer Science and Business Media. (c) Seven slack test experiments on a single skinned fibre preparation from rat leg muscle (from Galler et al. [218]; with permission). The upper panels show fibre length, Δl is the release amplitude. The lower panels show the force. Arrows indicate end of unloaded shortening, Δt is the time to the redevelopment of force. Approximative twisting stages of the Z-filaments are indicated.

