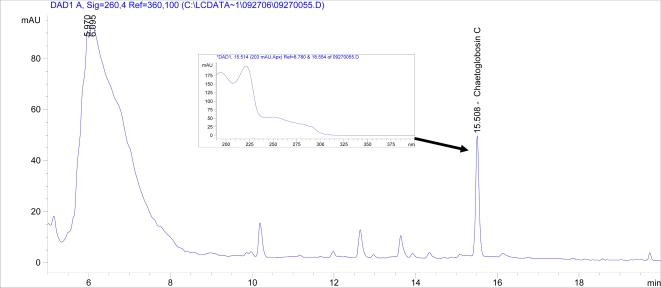
Figure 3.
HPLC chromatogram with UV spectra of selected peak inserted. The chromatogram shows the signal obtained from the methanol extract of C. globosum grown on five citrate phosphate buffered potato dextrose agar plates at a pH of 7.01 for four weeks. The retention times (min) are plotted on the x-axis and the peak sizes (in milli-absorbance units) on the y-axis. For UV spectrum (inset), wavelengths (in nanometers) are plotted on the x-axis and peak sizes (in milli-absorbance units) on the y-axis.

