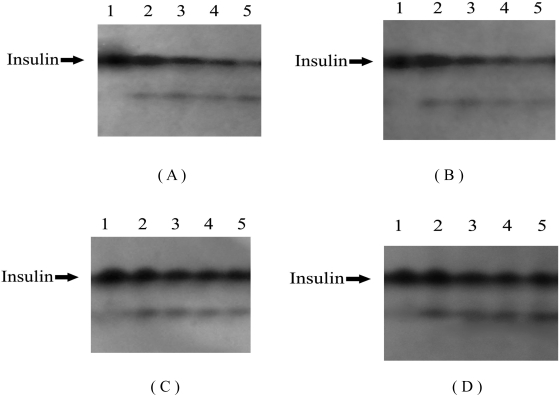
Figure 4.
Effects of HP-β-CD and protamine on degradation of insulin induced by trypsin. Lanes 1-5 in (A) represent insulin incubated with trypsin at 37 ºC for 0, 15, 30, 45 and 60 min, respectively; Lanes 1-5 in (B) represent insulin incubated with trypsin and HP-β-CD at 37 ºC for 0, 15, 30, 45 and 60 min, respectively; Lanes 1-5 in (C) represent insulin incubated with trypsin and protamine at 37 ºC for 0, 15, 30, 45 and 60 min, respectively; Lanes 1-5 in (D) represent insulin incubated with trypsin, HP-β-CD and protamine at 37 ºC for 0, 15, 30, 45 and 60 min, respectively.

