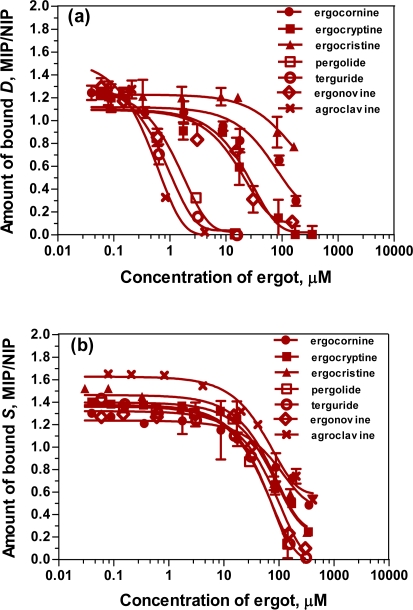
Figure 8.
Plots of the ratio of the normalized signal (B/Bî) for MIP to that obtained for NIP against the logarithm of the ergot concentrations for the competitive ligand binding assay using DS-MIP as adsorbent phase and (a) D and (b) S as a fluorescent probe. The values shown are mean ± SD of three replicate specimens.

