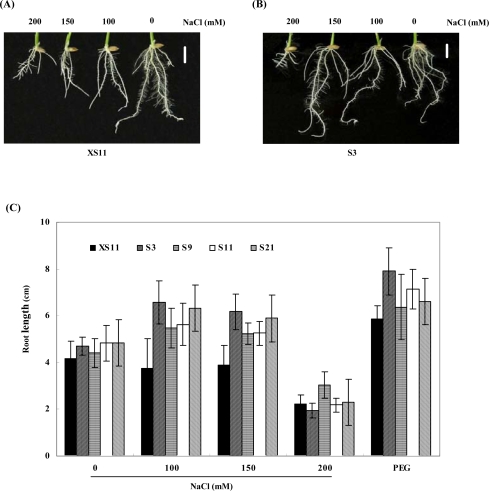
Figure 2.
Effect of salt stress on rice seedlings of control and transgenic lines.
The germinated seeds were planted onto 1/2MS with 200, 150, 100 mM or without NaCl, respectively. Photos were taken after 14 days of growth. (A) The root growth of control plant (XS11) under salt stress. (B) The root growth of overexpression line (S3) under salt stress. The bar indicates 2.0 cm. (C) The root length of each line under the same treatment. Values are means of at least 10 different plants in each line detected, and bars are standard errors. Numbers indicate independent lines of transgenic T2 plants, and XS11 is a control one.

