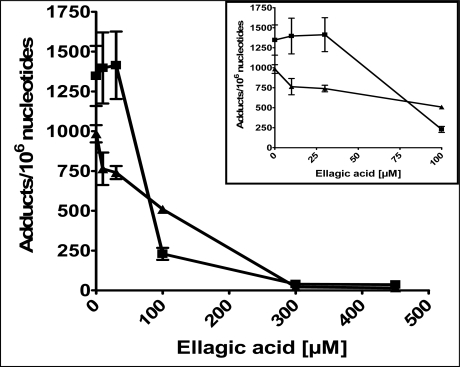
Figure 2.
Effect of increasing concentrations of ellagic acid on oxidative DNA damage. Both unidentified oxidative adducts (triangles) and 8-oxodG (squares) were measured using 32P-postlabeling/TLC and are represented as mean ± SE of 4 replicates. The inset shows the effects at lower concentrations. The test for linear trend (Scheffe’s t-test) was statistically significant with a p-value <0.0001.

