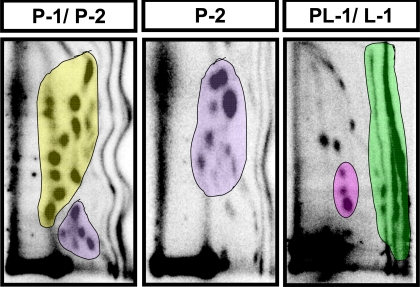
Figure 4.
Representative maps of 32P-labeled endogenous DNA adducts from liver of CD-1 mice. Mice were fed either a control diet or diet supplemented with strawberry, blueberry or red raspberry (5% w/w each). Labeled adducts were separated by 2-D PEI-cellulose TLC as described in Materials and Methods. Adducts were classified into different subgroups (P-1- yellow; P-2- purple; PL-1- pink; L-1- green) based on their polarities, which was in the following descending order, P-1 >P-2 > PL-1 > L1 as described [13]

